Press and Reports

Report · 18 pages

Lake Huntington Testing Assessment

Jack Nearing and Frank Podlaski ·

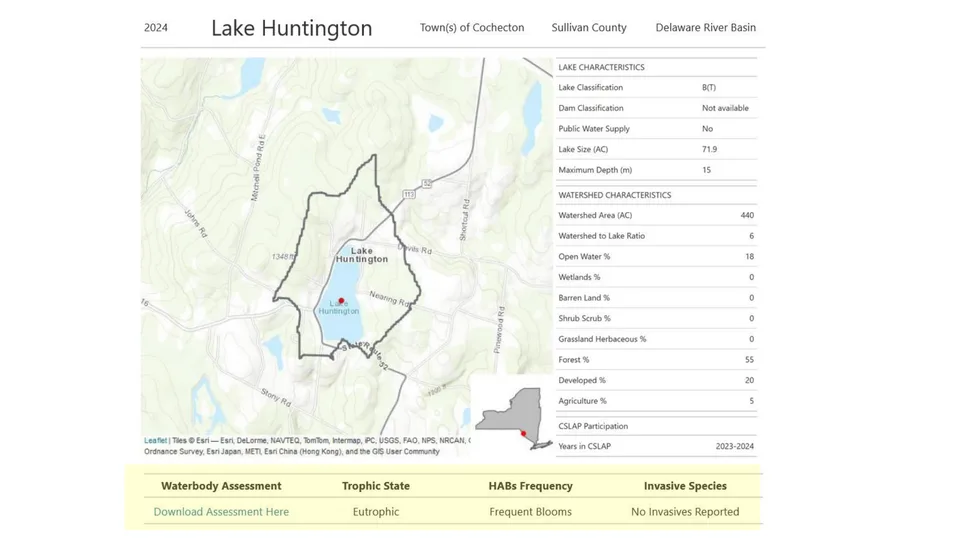
NYS DEC 2024 lake profile (slide 2)

Trophic State
Eutrophic
HABs Frequency
Frequent Blooms
Invasive Species
No Invasives Reported
Lake Size (AC)
71.9
Maximum Depth (m)
15
Years in CSLAP
2023-2024

Key findings

In the authors’ words, from the slides:

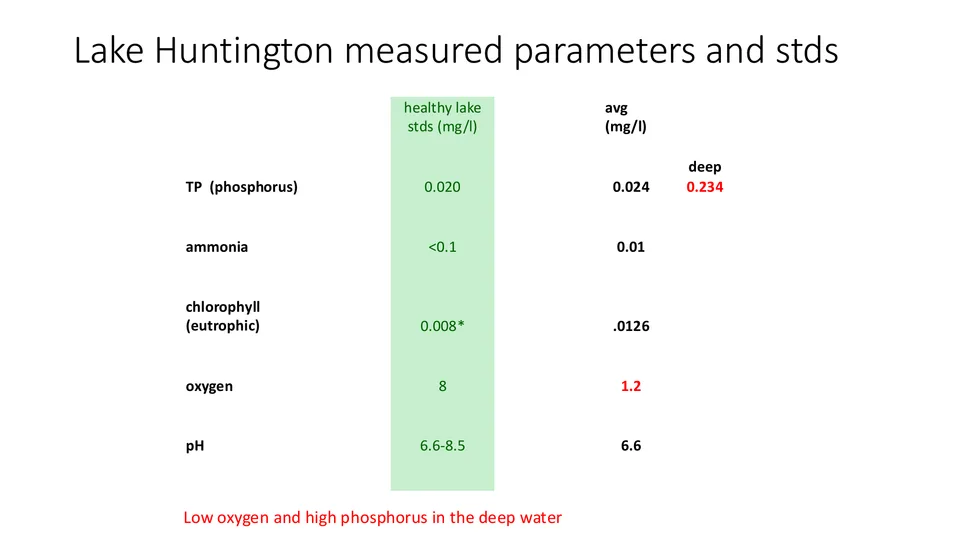
  • Low oxygen and high phosphorus in the deep water
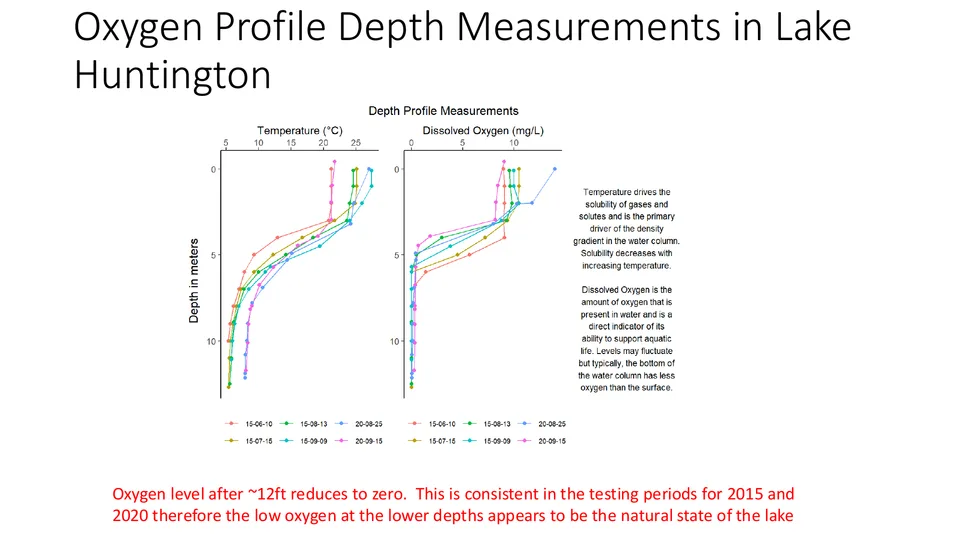
  • Oxygen level after ~12ft reduces to zero. This is consistent in the testing periods for 2015 and 2020 therefore the low oxygen at the lower depths appears to be the natural state of the lake
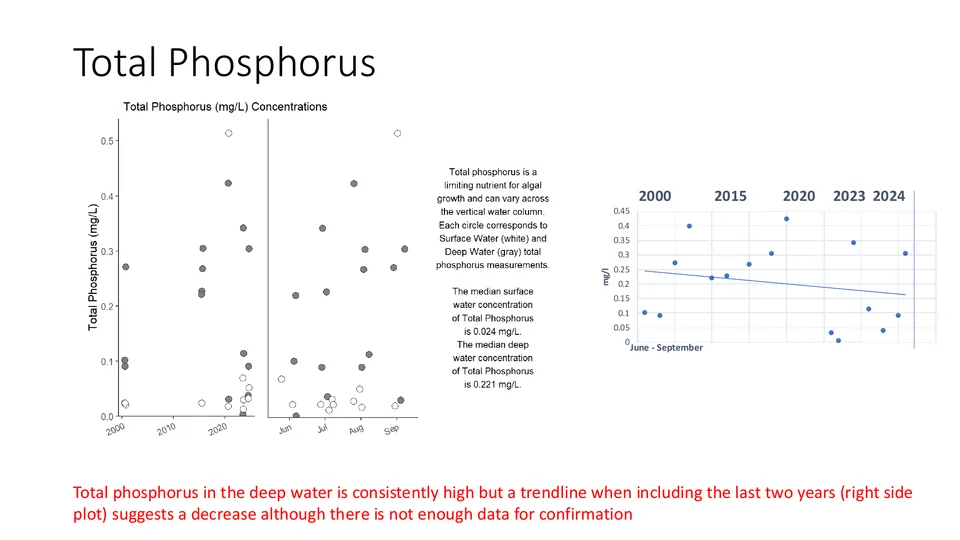
  • Total phosphorus in the deep water is consistently high but a trendline when including the last two years (right side plot) suggests a decrease although there is not enough data for confirmation
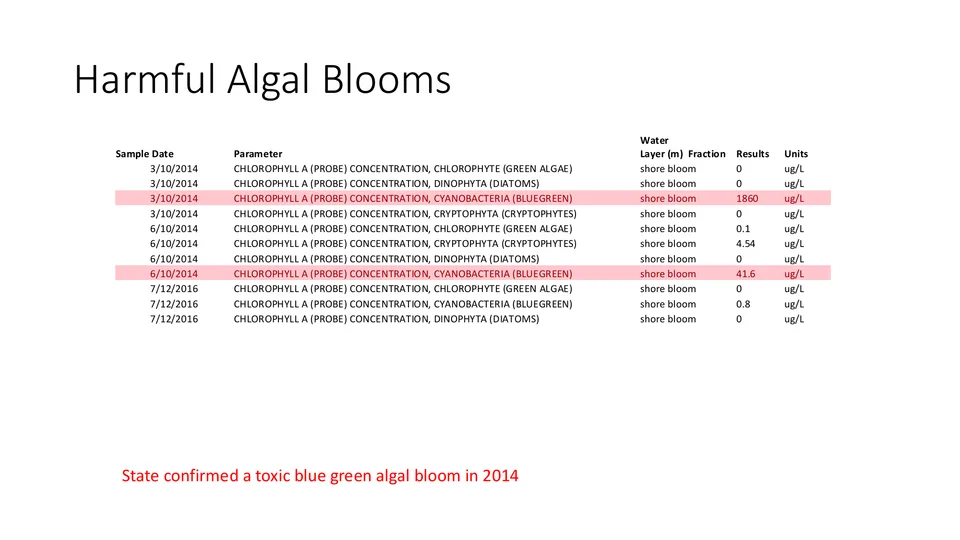
  • State confirmed a toxic blue green algal bloom in 2014
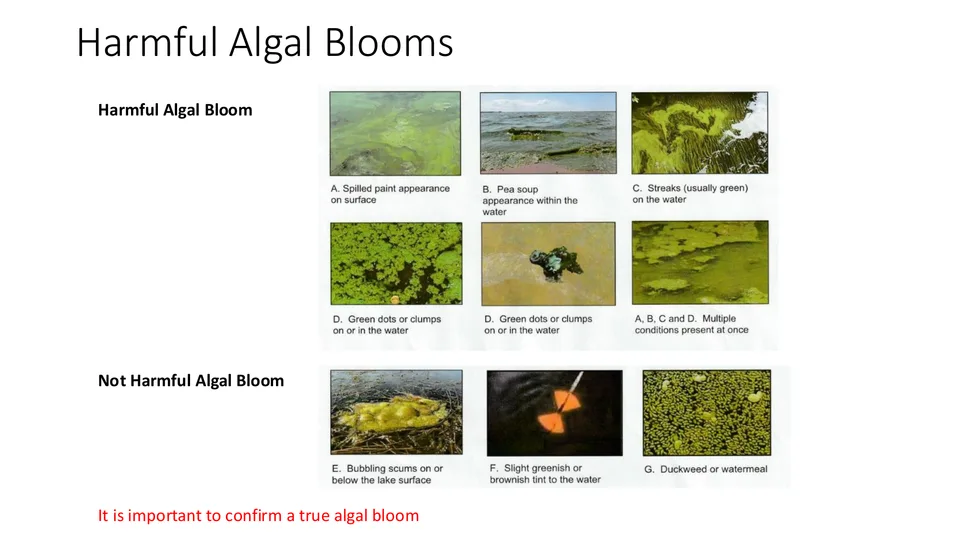
  • It is important to confirm a true algal bloom
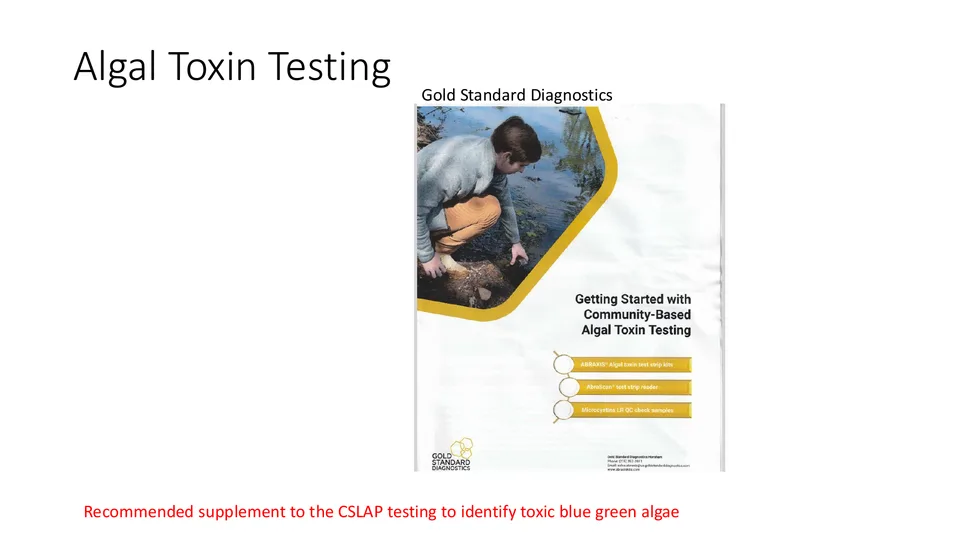
  • Algal Toxin Testing: Recommended supplement to the CSLAP testing to identify toxic blue green algae

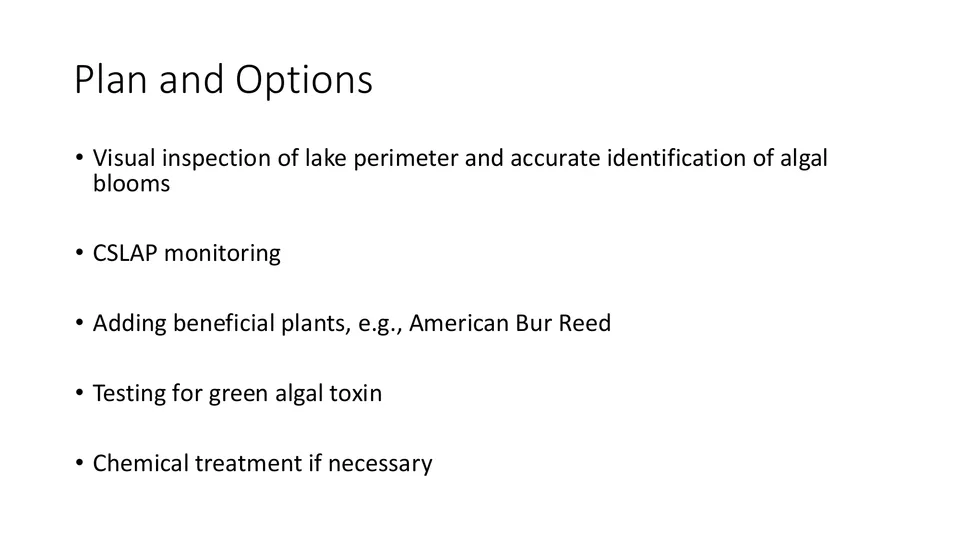
Plan and Options

  • Visual inspection of lake perimeter and accurate identification of algal blooms
  • CSLAP monitoring
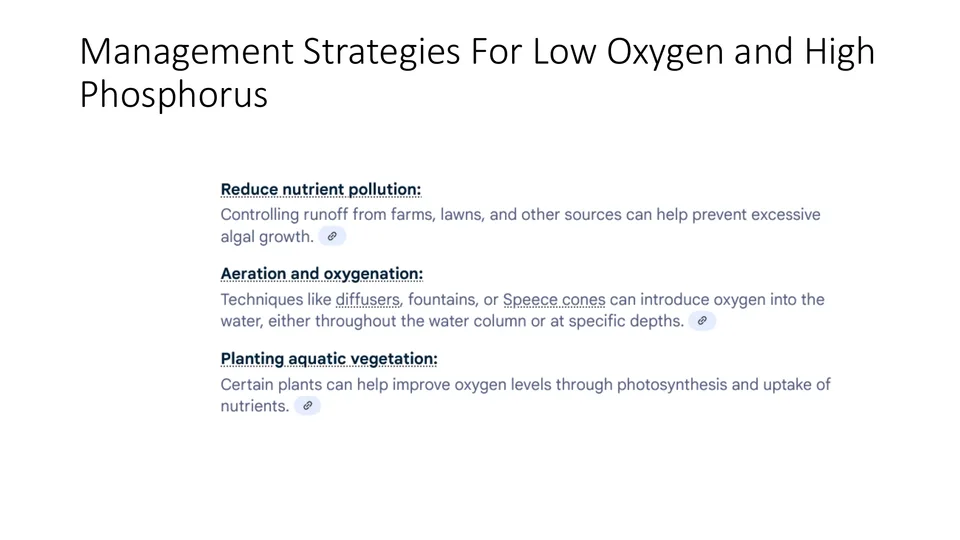
  • Adding beneficial plants, e.g., American Bur Reed
  • Testing for green algal toxin
  • Chemical treatment if necessary

Measured parameters and standards (slide 5)

ParameterHealthy lake stds (mg/l)Avg (mg/l)Deep
TP (phosphorus)0.0200.0240.234
ammonia<0.10.01
chlorophyll (eutrophic)0.008*.0126
oxygen81.2
pH6.6-8.56.6

The full report

1 / 18
  1. Title slide: Lake Huntington, Testing assessment. 7/3/2025, edited 7/7/2025. Jack Nearing and Frank Podlaski
    Slide 1 of 18
  2. 2024 NYS DEC lake profile for Lake Huntington: watershed map and characteristics table. Trophic state Eutrophic, HABs frequency Frequent Blooms, No Invasives Reported
    Slide 2 of 18
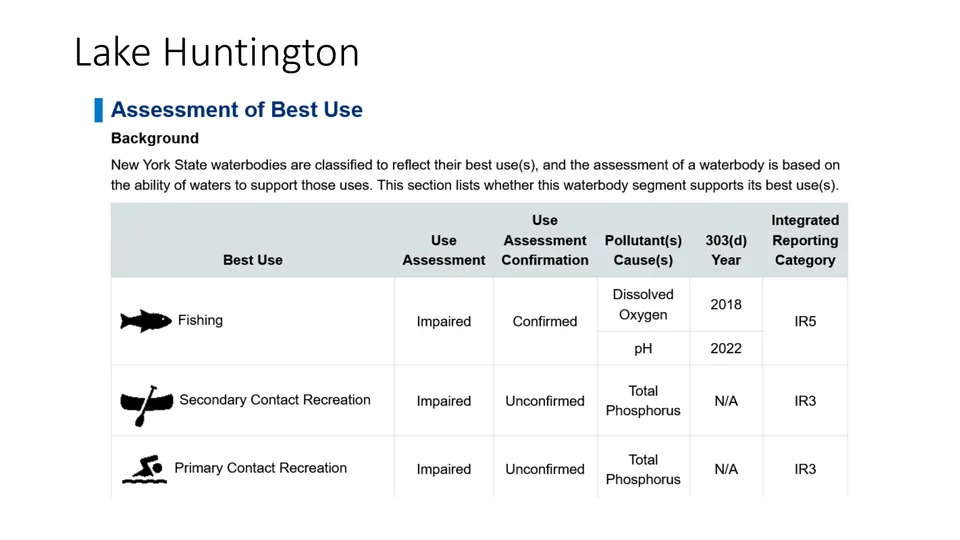
  3. Assessment of Best Use table: Fishing impaired (confirmed; dissolved oxygen 2018, pH 2022), secondary and primary contact recreation impaired (unconfirmed; total phosphorus)
    Slide 3 of 18
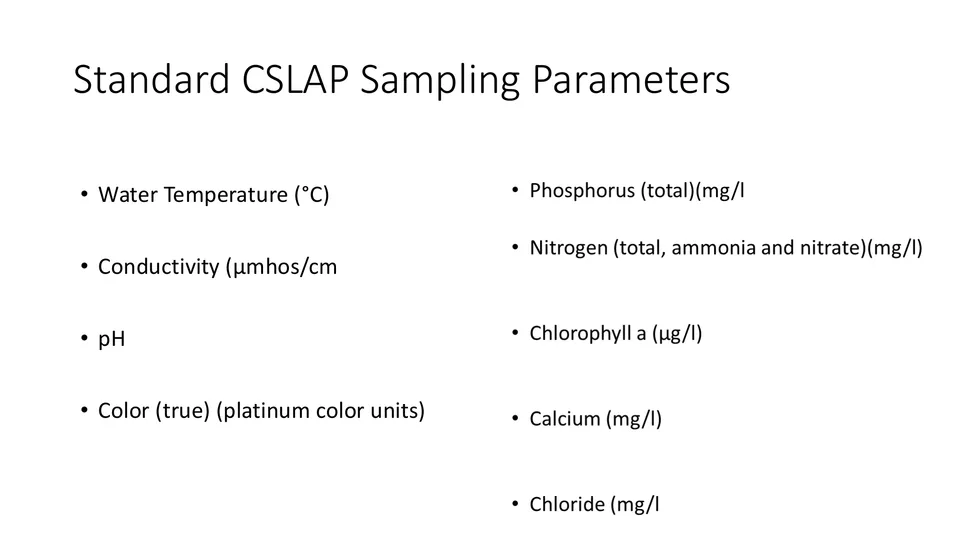
  4. Standard CSLAP sampling parameters: water temperature, conductivity, pH, color, phosphorus, nitrogen, chlorophyll a, calcium, chloride
    Slide 4 of 18
  5. Lake Huntington measured parameters compared with healthy lake standards. Caption: Low oxygen and high phosphorus in the deep water
    Slide 5 of 18
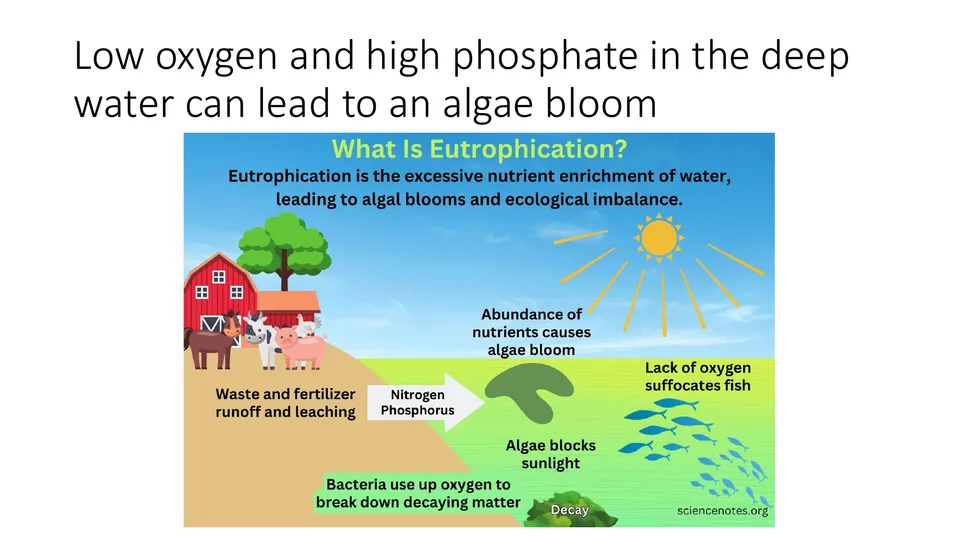
  6. Eutrophication diagram: nutrient runoff causes algae blooms, algae block sunlight, bacteria use up oxygen and fish suffocate
    Slide 6 of 18
  7. Temperature and dissolved oxygen depth profiles for 2015 and 2020; oxygen drops to zero below about 12 feet
    Slide 7 of 18
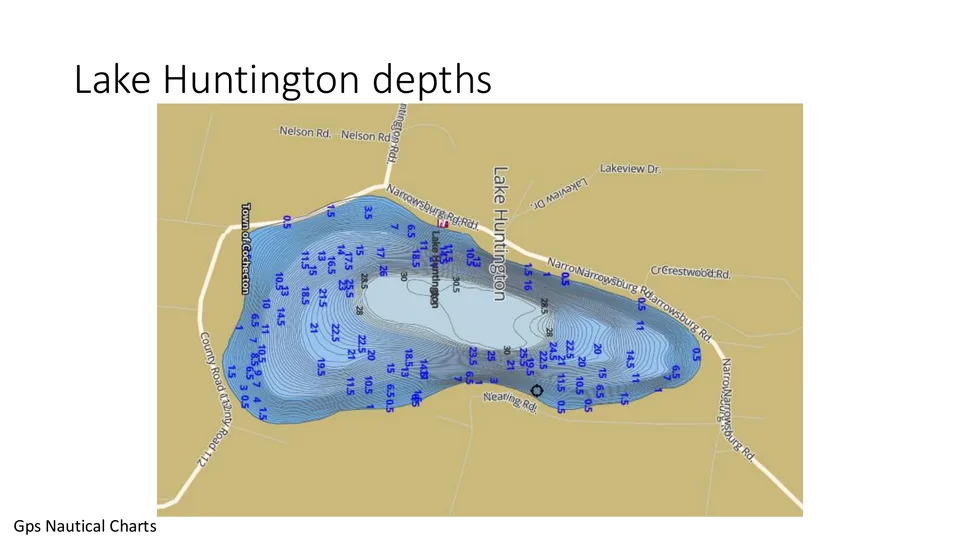
  8. Lake Huntington depth chart from GPS Nautical Charts, with depth soundings across the lake
    Slide 8 of 18
  9. Total phosphorus concentration charts, surface and deep water, 2000 to 2024, with a trendline
    Slide 9 of 18
  10. Photo guide to harmful algal blooms versus blooms that are not harmful
    Slide 10 of 18
  11. Table of 2014 and 2016 shore bloom samples; cyanobacteria (bluegreen) readings highlighted. Caption: State confirmed a toxic blue green algal bloom in 2014
    Slide 11 of 18
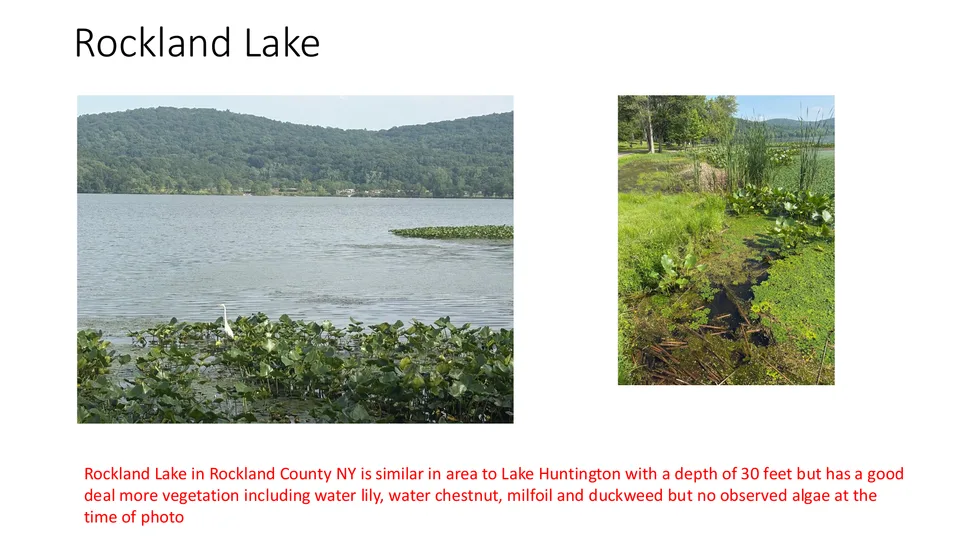
  12. Two photos of Rockland Lake with water lilies and shoreline vegetation, used for comparison
    Slide 12 of 18
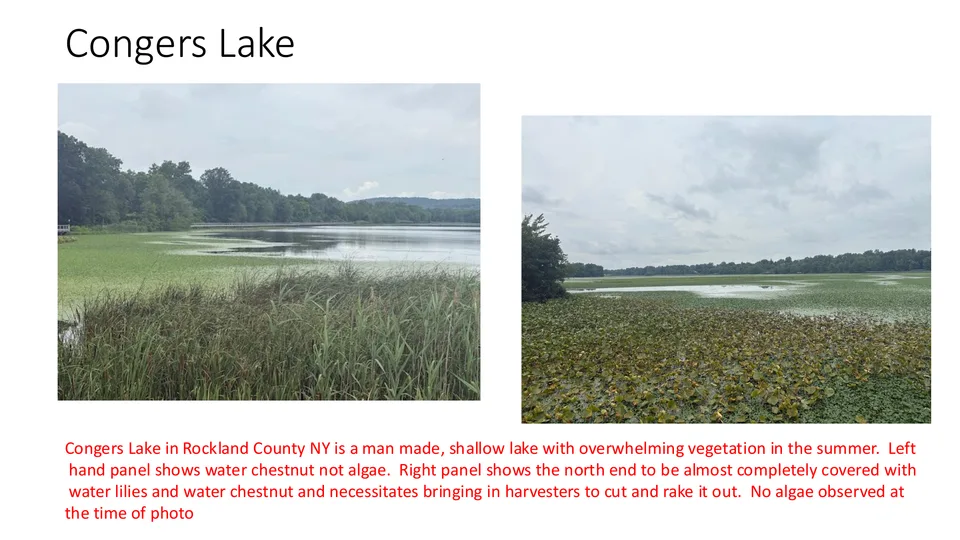
  13. Two photos of Congers Lake covered with water chestnut and water lilies, used for comparison
    Slide 13 of 18
  14. Management strategies for low oxygen and high phosphorus: reduce nutrient pollution, aeration and oxygenation, planting aquatic vegetation
    Slide 14 of 18
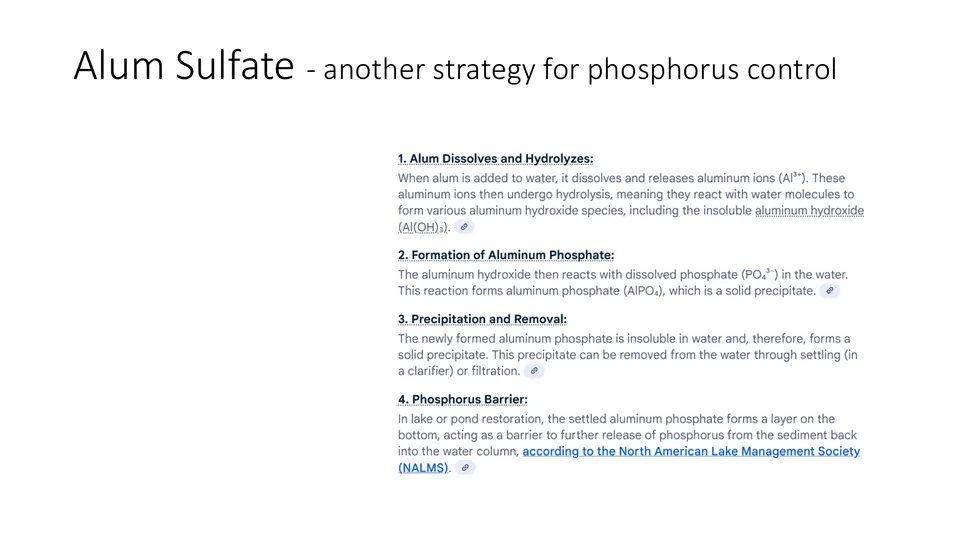
  15. How alum sulfate controls phosphorus, in four steps, ending with a phosphorus barrier on the lake bottom
    Slide 15 of 18
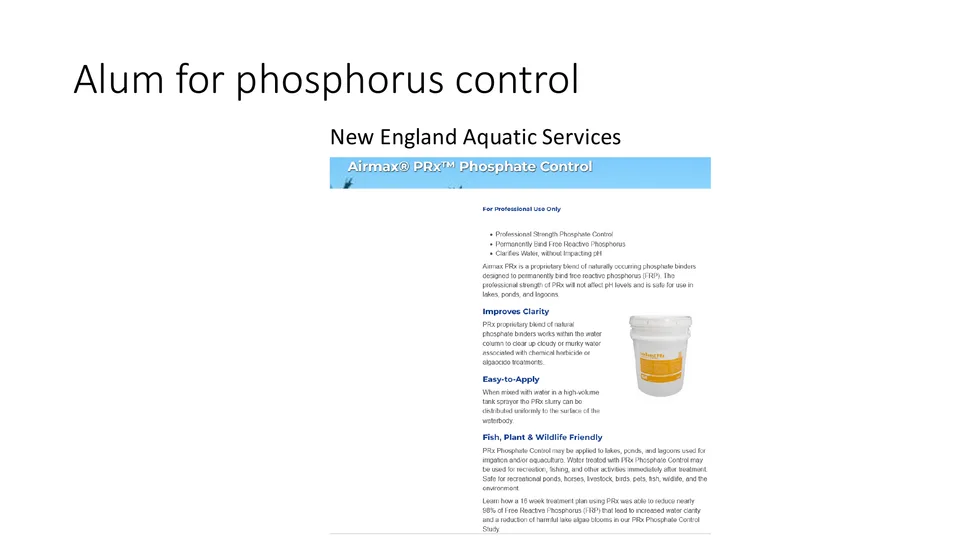
  16. Product sheet from New England Aquatic Services for Airmax PRx phosphate control
    Slide 16 of 18
  17. Gold Standard Diagnostics brochure cover: Getting Started with Community-Based Algal Toxin Testing
    Slide 17 of 18
  18. Plan and Options slide listing five next steps
    Slide 18 of 18

Download PDF (1.9 MB)